Display History
In Aqara Studio, you can quickly check and analyze historical data for device function points. Just set up collection rules, and the system will automatically track and show how a function point’s status changes over time. This helps you spot trends, find problems, and adjust device settings as needed. Below are the steps to configure and view historical data.
Steps
-
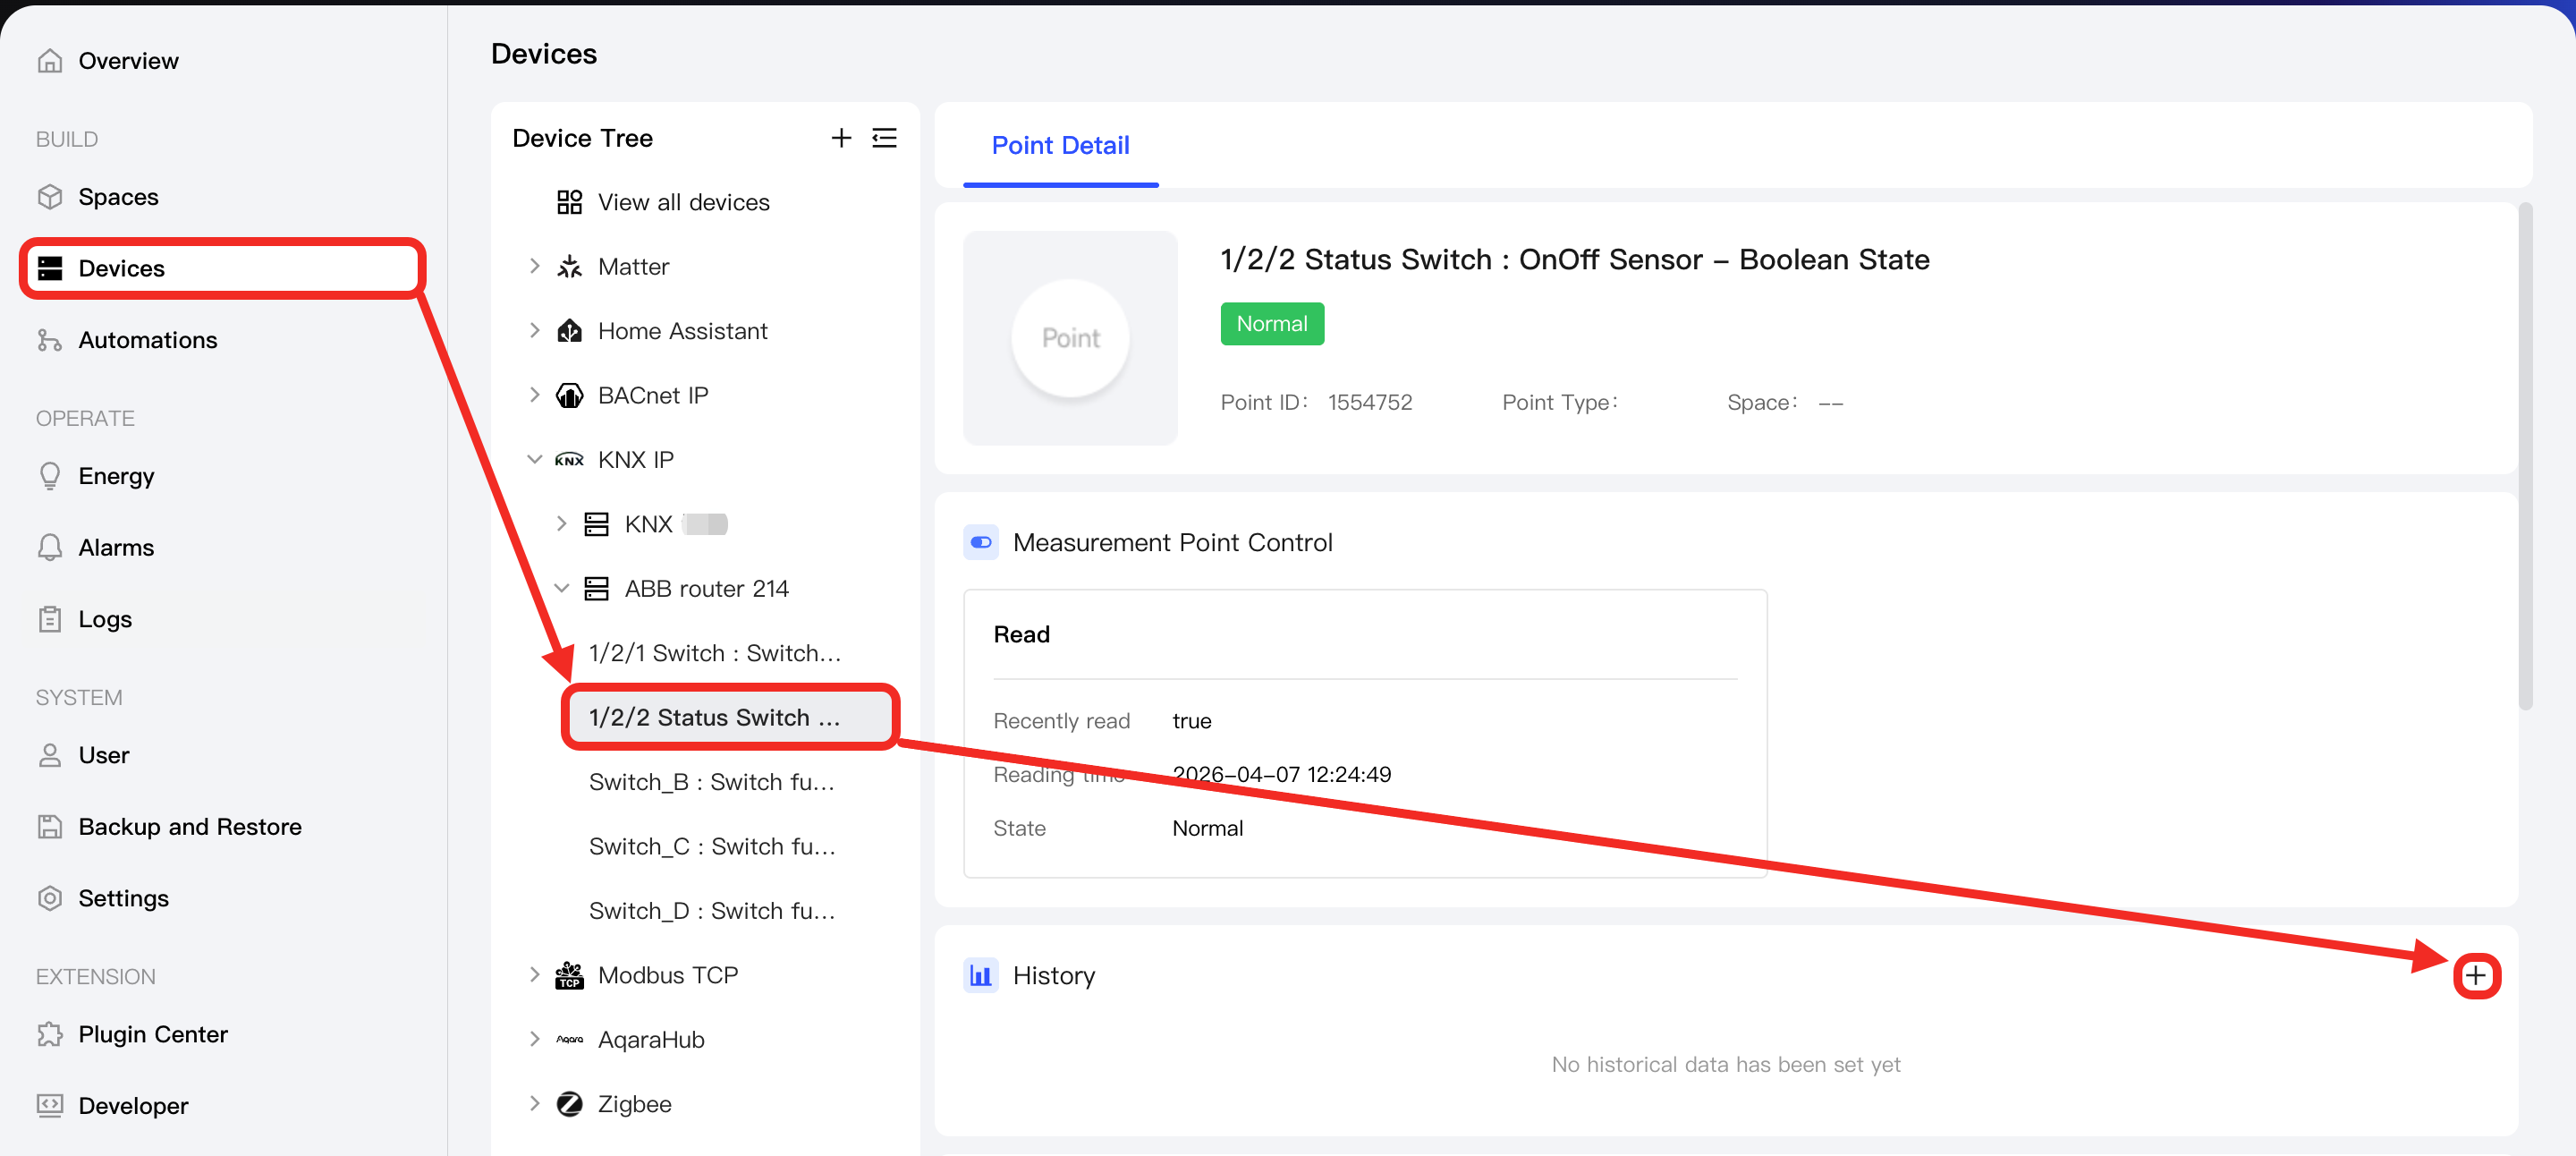
Go to the Devices page, and click the function point you want to view in the device tree on the left. Find the "History" section and click the + button.
-
In the "Historical data configuration" popup, configure and save the following parameters:
Parameter Description Name A customizable name for the historical data configuration, for easy identification. Collection Type - Cov: Data is collected only when the value changes exceed the set threshold (e.g., 5).
- Interval: Data is collected at fixed time intervals (e.g., 5000 ms).
Threshold Setting Available when the function point type is Numeric and Collection Typesis set to "Cov". It specifies the magnitude of data change that triggers collection.Interval The time interval for data collection, in milliseconds (ms). This parameter is applicable only when Collection Typeis set to "Interval".Max collections It limits the maximum number of historical data records. When the limit is reached, the oldest data will be overwritten. 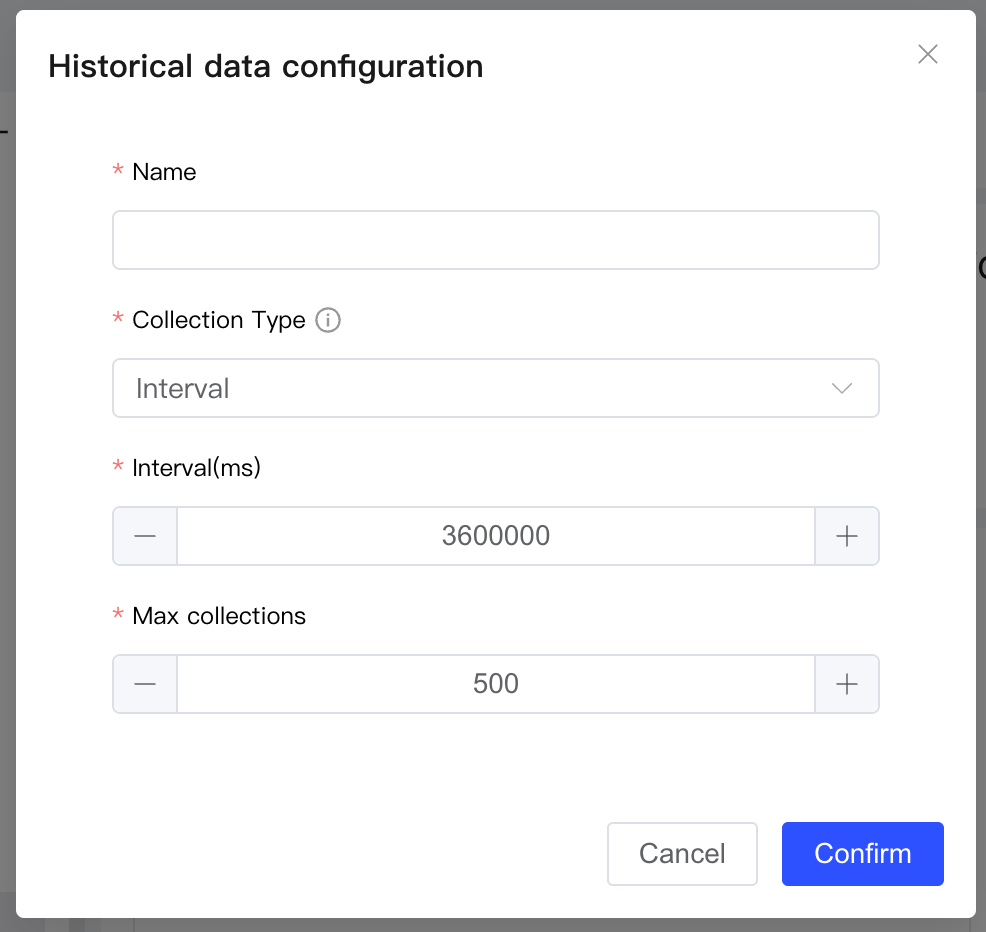
-
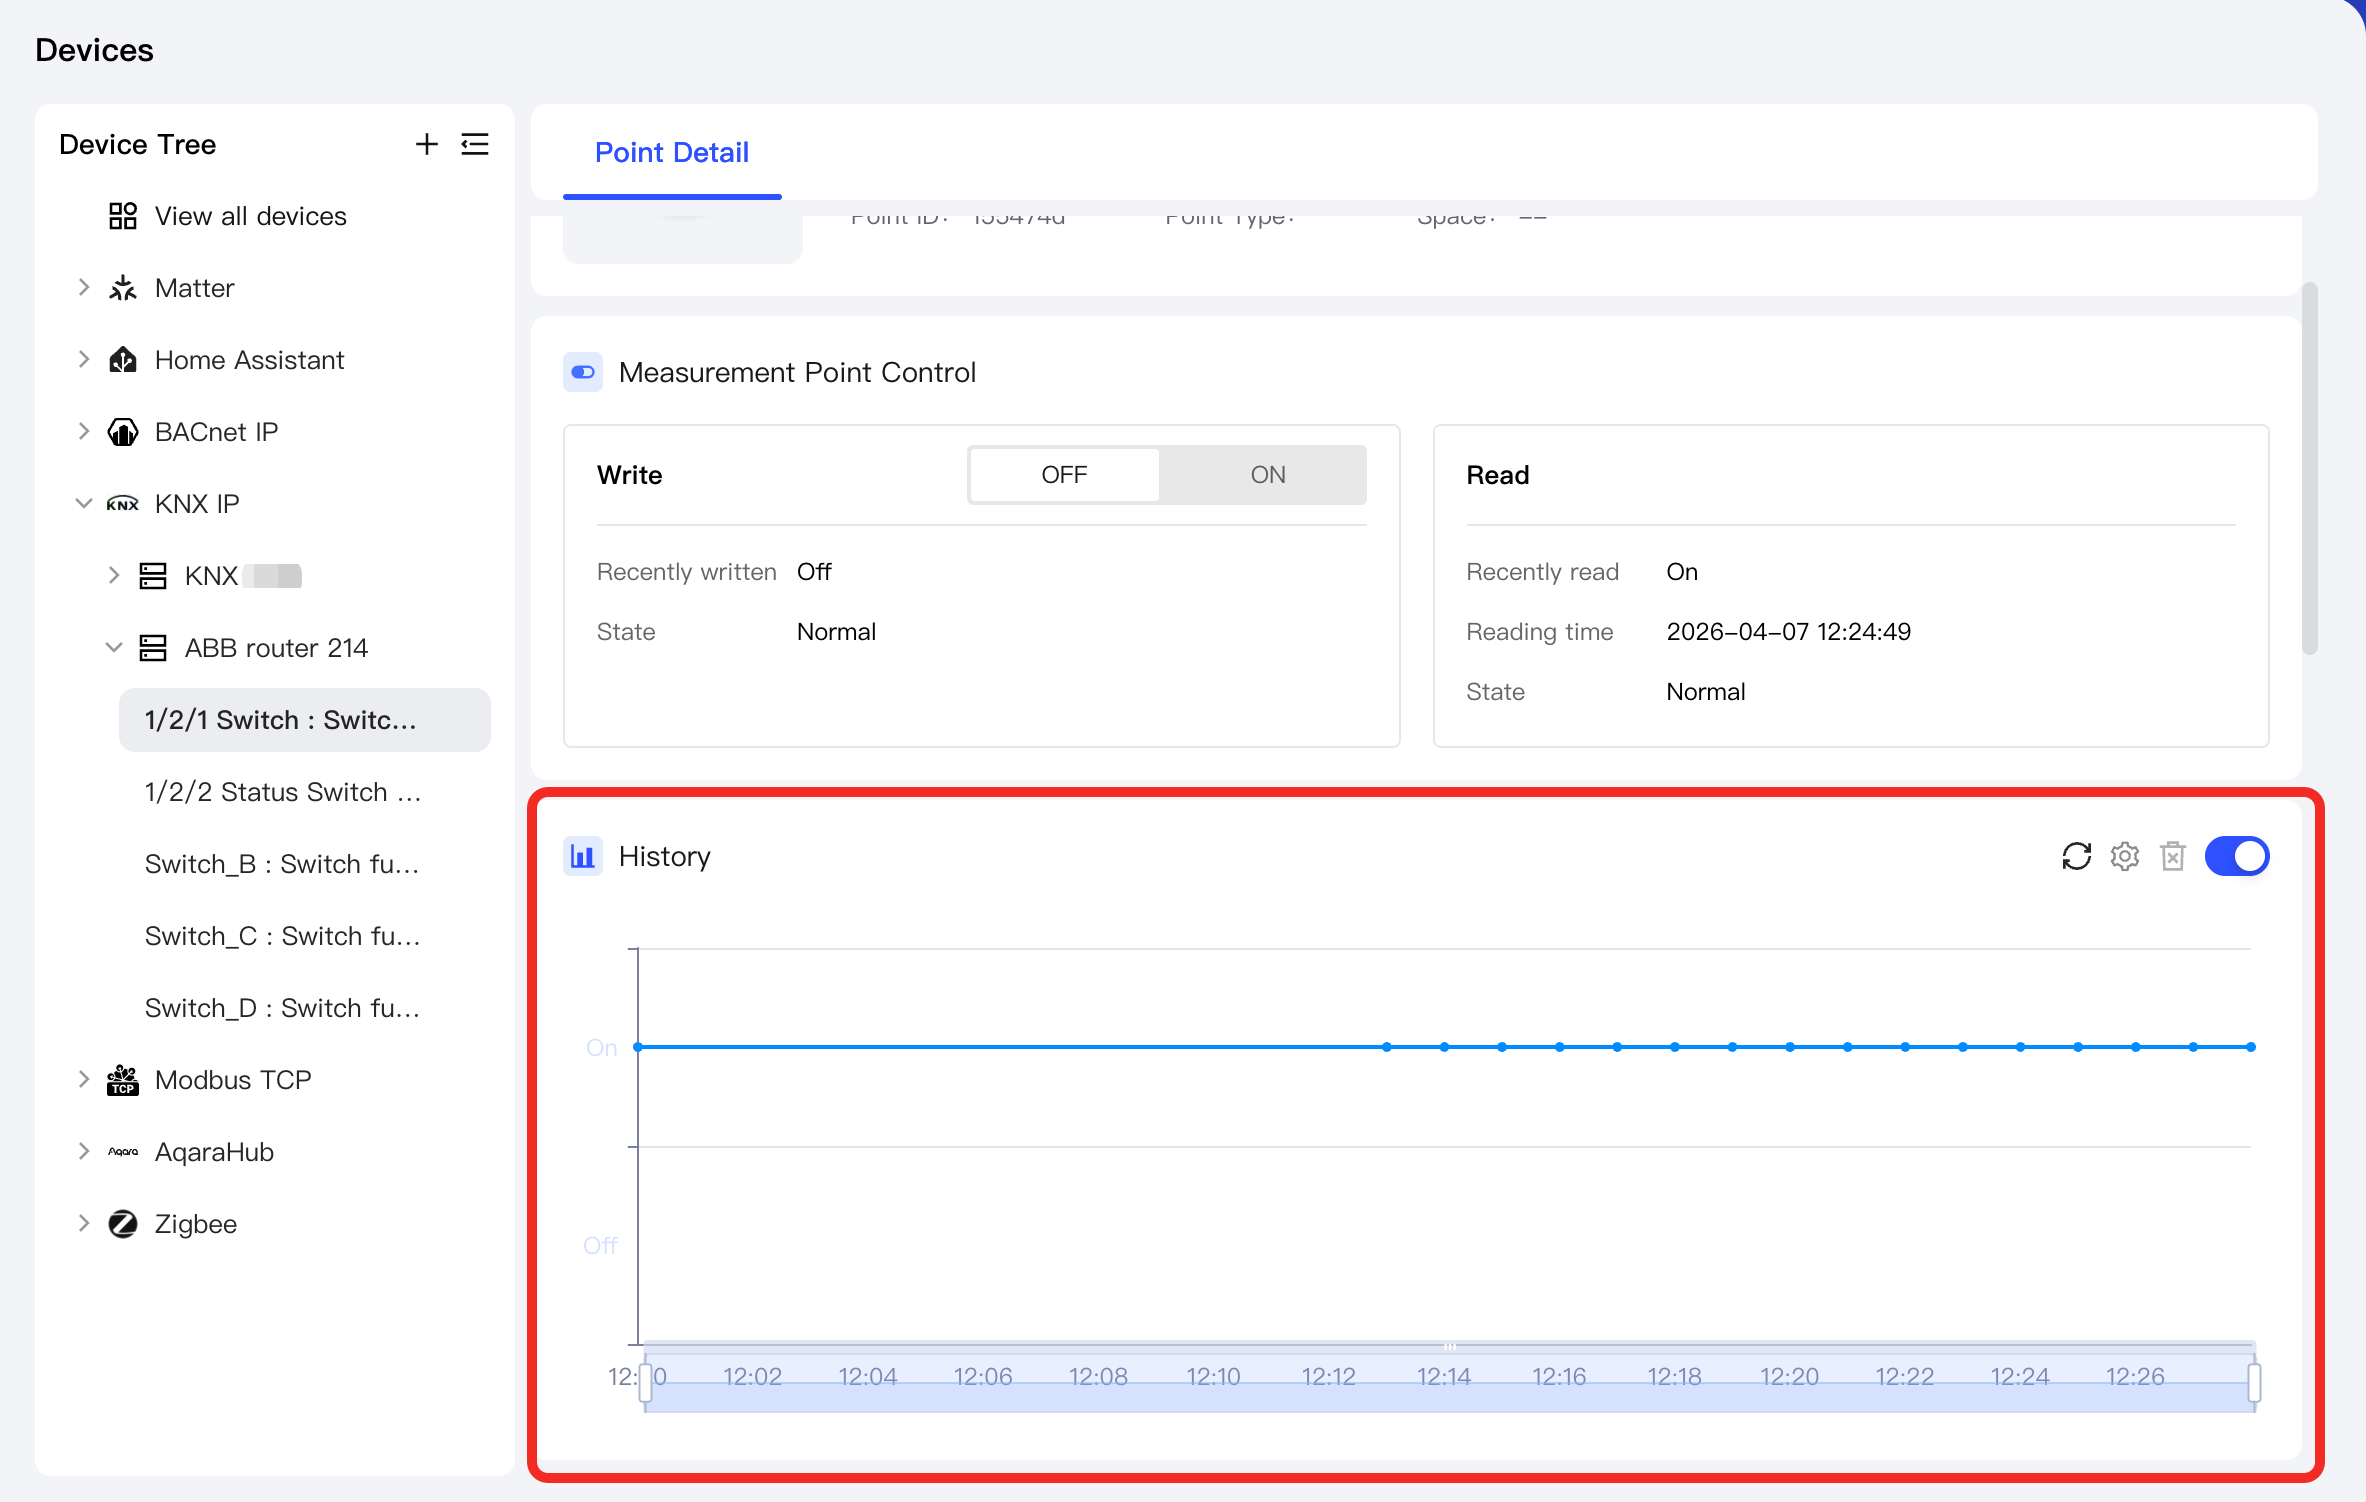
After configuration, the "History" area will automatically generate and display a history digram based on the rule. It helps you intuitively analyze the function point data trend.